Supported · Entries · 2026-10-11
Fixing our random-entry control
What this means
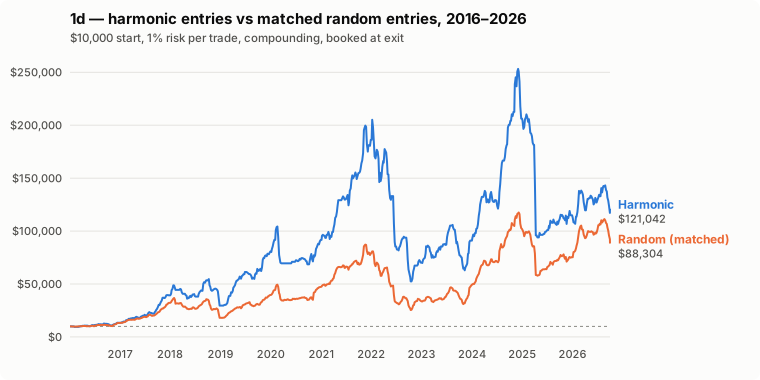
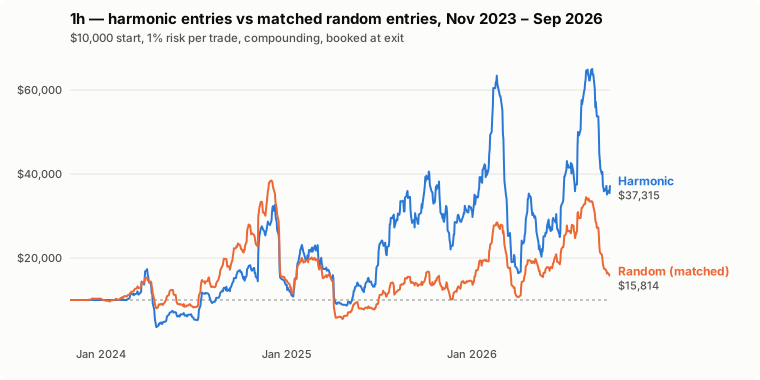
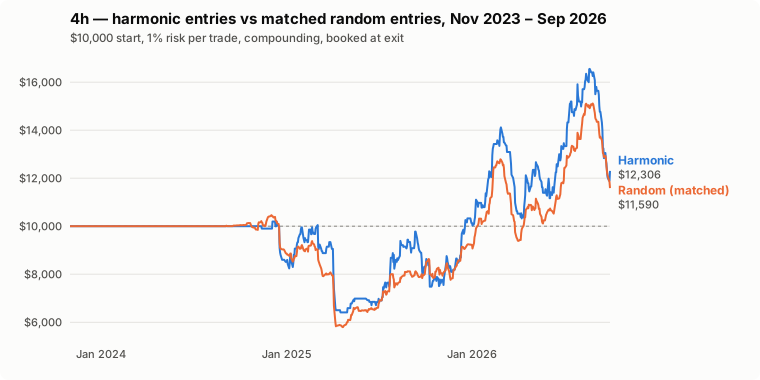
The time mismatch was real. Whole-period randoms came from different markets, which mattered most on 4h, where trades bunch in 2025-26. The open/close fix barely matters. Fixed, harmonics sit at roughly +0.0 to +0.05R over random: still small, and on daily confined to 2016-20. No time-local control is clean. Randoms just before the signal benefit from look-ahead, and randoms in the weeks before sit in the decline into D. Randoms drawn only after the entry are the cleanest choice.
Explanation checked against the data.
- Hypothesis
- The random-entry control was biased against harmonic entries in two ways. It drew random days from all of 2016-2026 rather than near the trade. It also entered at the close and skipped that bar, while harmonics enter at the open and the bar counts. Fixing both raises the harmonic edge.
- Method
- Same samples and harmonic trades as entry-vs-random (logged stop -> 2R, full exit; 1d n=2,006 2016-26; 1h n=3,414 / 4h n=735 2023-11 to 2026-09). The original runs were reproduced exactly. Four controls, 20 randoms per trade, same ticker, stop % and target %: (a) original; (b) open entry with the entry bar counting; (c) close entry within +-60 trading days of the entry; (d) both fixes. Sensitivity: +-20 days. Ticker-clustered bootstrap CIs; both halves. Descriptive split of the (d) window into randoms before vs after the entry.
- Result
- Edge (95% CI), (a) / (b) / (c) / (d). 1d: -0.02 (-0.08,+0.04) / -0.03 / +0.02 / +0.05 (-0.00,+0.09), halves under (d) +0.12 / -0.00. 1h: +0.01 / +0.01 / +0.05 / +0.05 (+0.01,+0.10), halves +0.09 / +0.01. 4h: -0.13 (-0.24,-0.04) / -0.11 / +0.01 / +0.01 (-0.07,+0.09). +-20 days: 1d -0.07 (-0.11,-0.04), 1h +0.06, 4h +0.02. Randoms after the entry only: 1d -0.03 (-0.08,+0.03), 1h +0.08 (+0.03,+0.12), 4h +0.02. Daily randoms 1-10 days before the signal earn +0.54 to +0.62R, against +0.25 to +0.32 after it.
- How much to trust it
- Medium: Exact reproduction of the old numbers; large n; but the time-local window has its own look-ahead (a signal implies D already held), so the result depends on which side of the entry the randoms come from
- Did it change the live rule?
- no live change; control (d) is now the default comparison in studies
- Notes
- A mechanical dip-buy (15% below the 60-day high) beats the same +-60-day control by +0.28 to +0.38R. The control is generous to any entry made after a decline. Superseded in part by entry-vs-random-pattern-span (2026-10-11): (d)'s +-60 window does hold contaminated randoms (the last 10 days before the fill, +0.59R on daily). But it also holds the X->D decline (+0.05R), so (d) roughly nets out. Removing only [D, fill] gives 1d +0.07 (+0.02,+0.12). The dip-buy note above used a different proxy and control; see dip-buy-vs-harmonic.
Browse every harmonic trade next to its 20 random twins →
Scripts and data for this study will be linked here when the research code is published on GitHub.
Education and research only. Not financial advice. Backtests use today's index members (survivorship bias).